── Attaching packages ─────────────────────────────────────── tidyverse 1.3.2 ──
✔ ggplot2 3.4.3     ✔ purrr   1.0.2
✔ tibble  3.2.1     ✔ dplyr   1.1.2
✔ tidyr   1.3.0     ✔ stringr 1.5.0
✔ readr   2.1.4     ✔ forcats 1.0.0
── Conflicts ────────────────────────────────────────── tidyverse_conflicts() ──
✖ dplyr::filter() masks stats::filter()
✖ dplyr::lag() masks stats::lag()Dplyr & Tidyr basics
Readings and class materials for Tuesday, September 19, 2023
The tidyverse
Tidyverse contains the most important packages that you’re likely to use in everyday data analyses:
ggplot2, for data visualisation. (Later on, as we direct our attention towards the process of visualization)
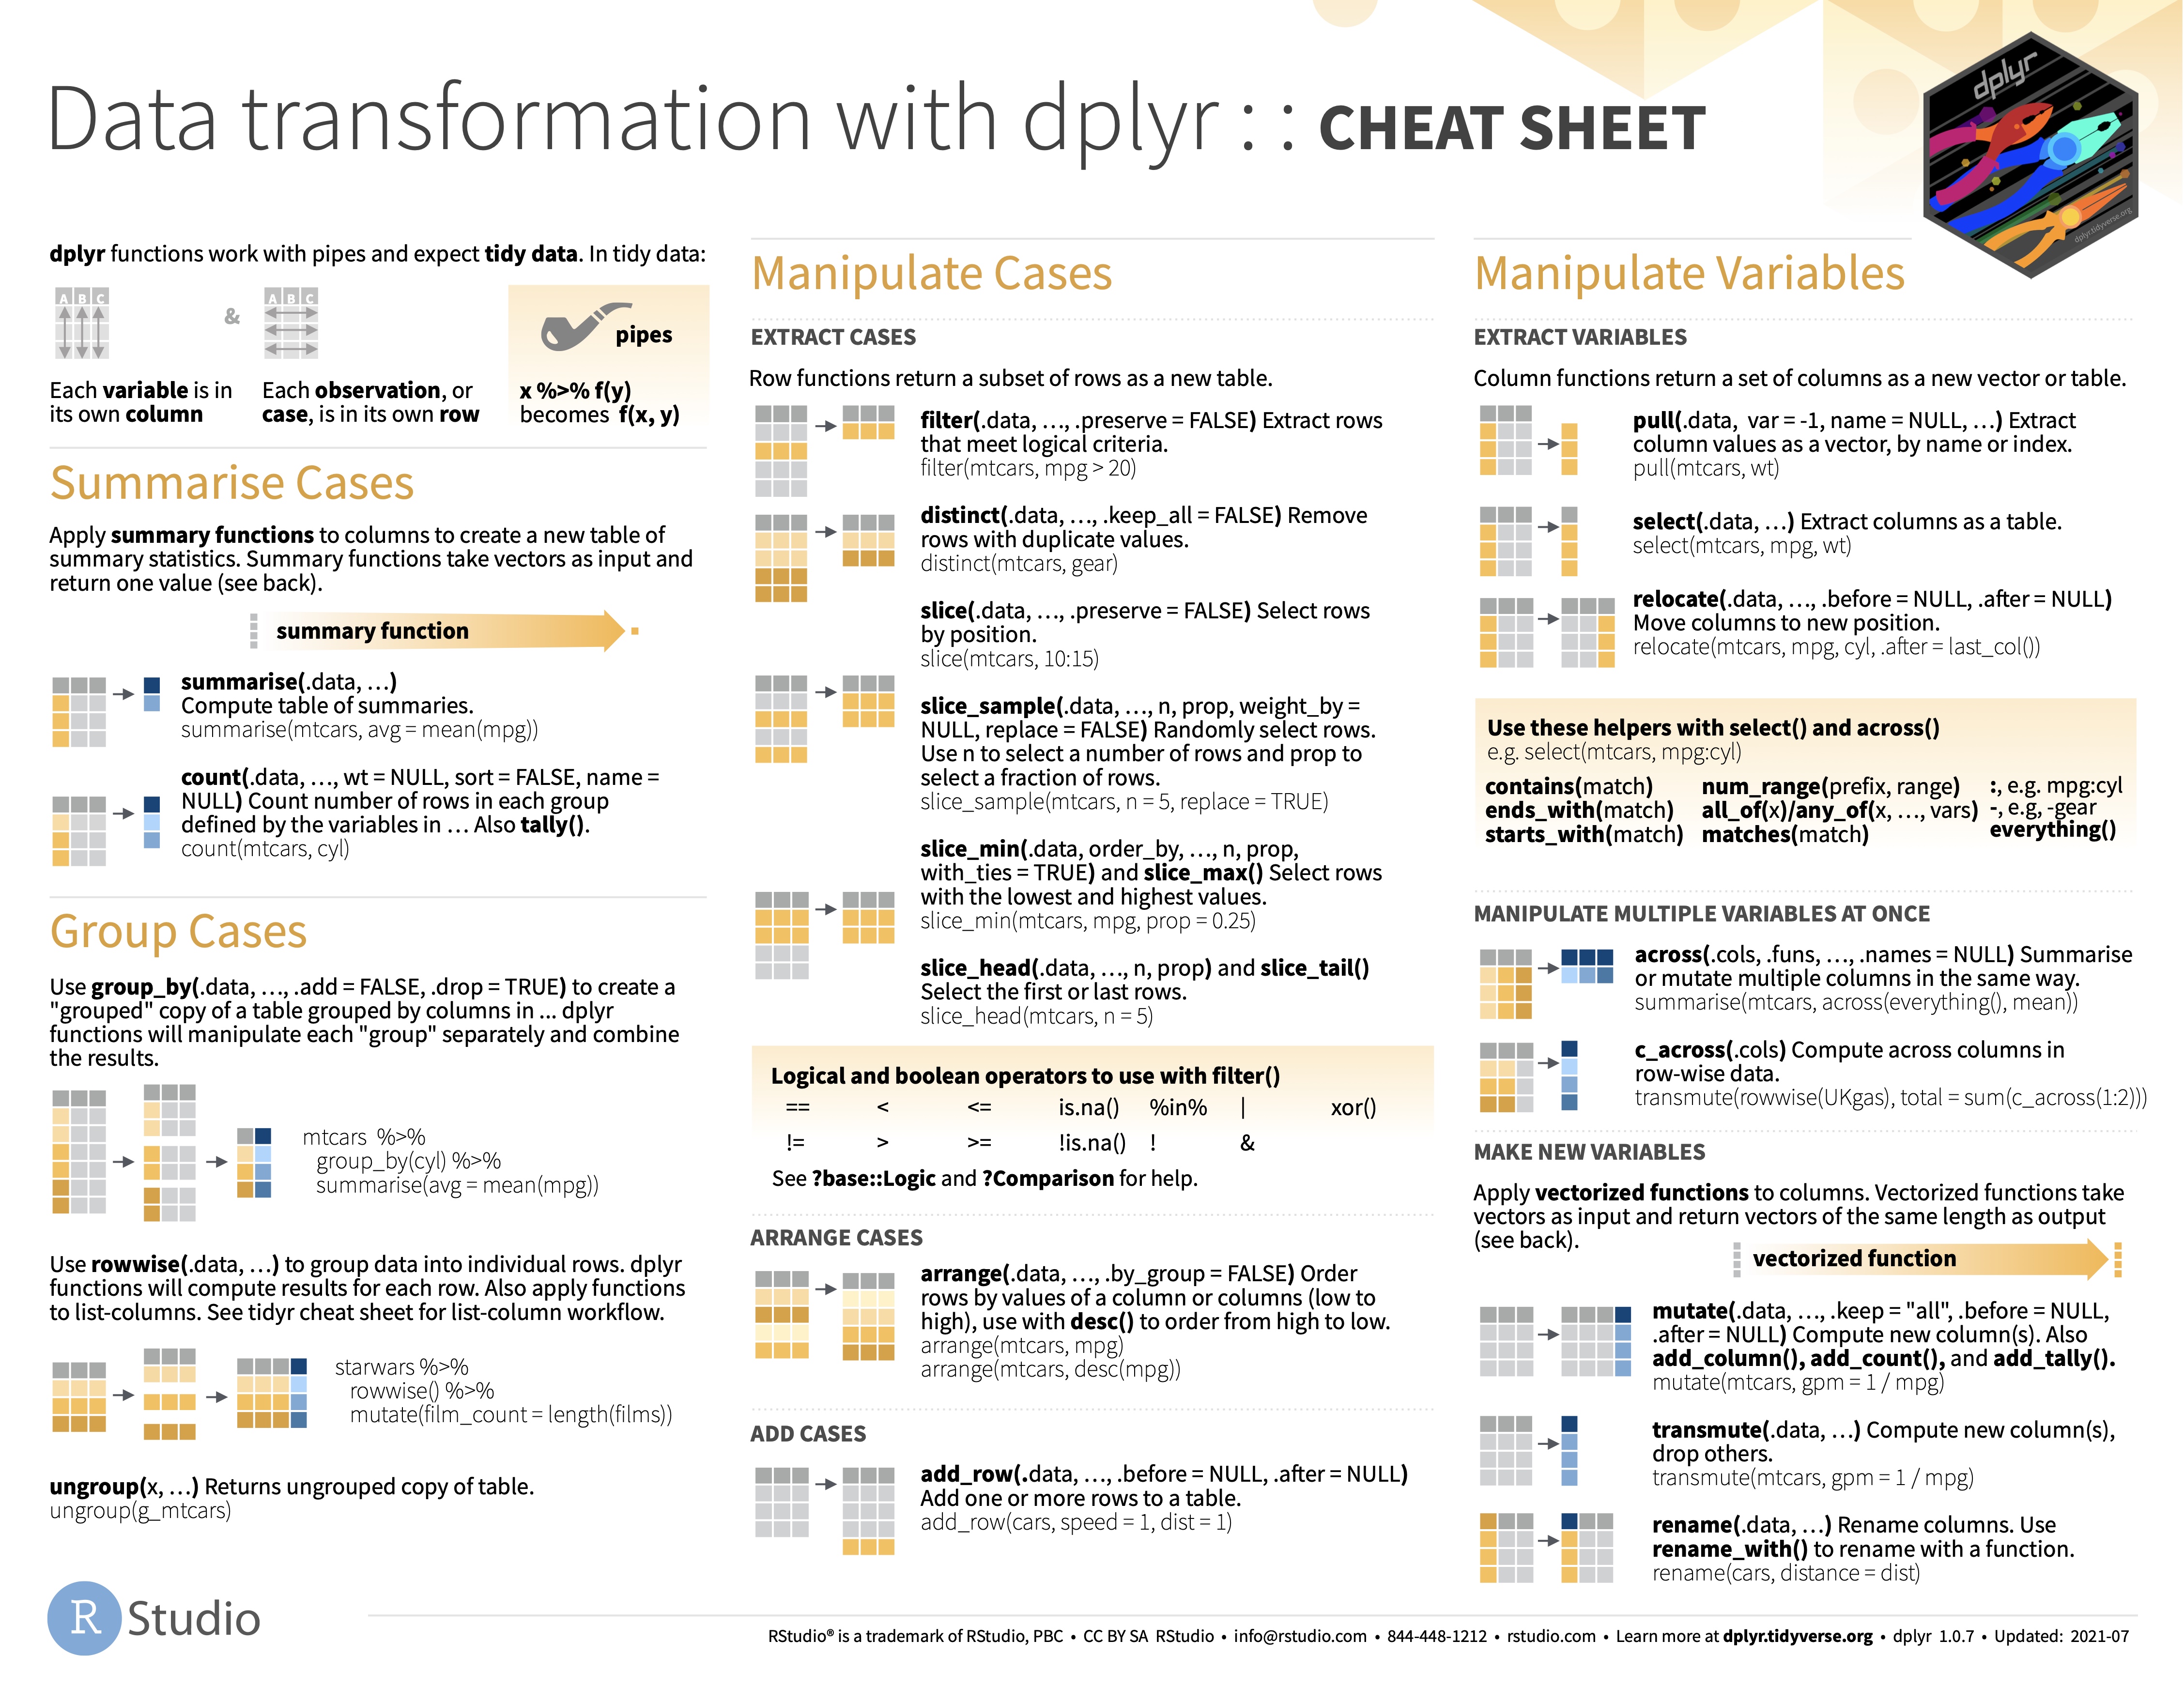
dplyr, for data manipulation. (now)
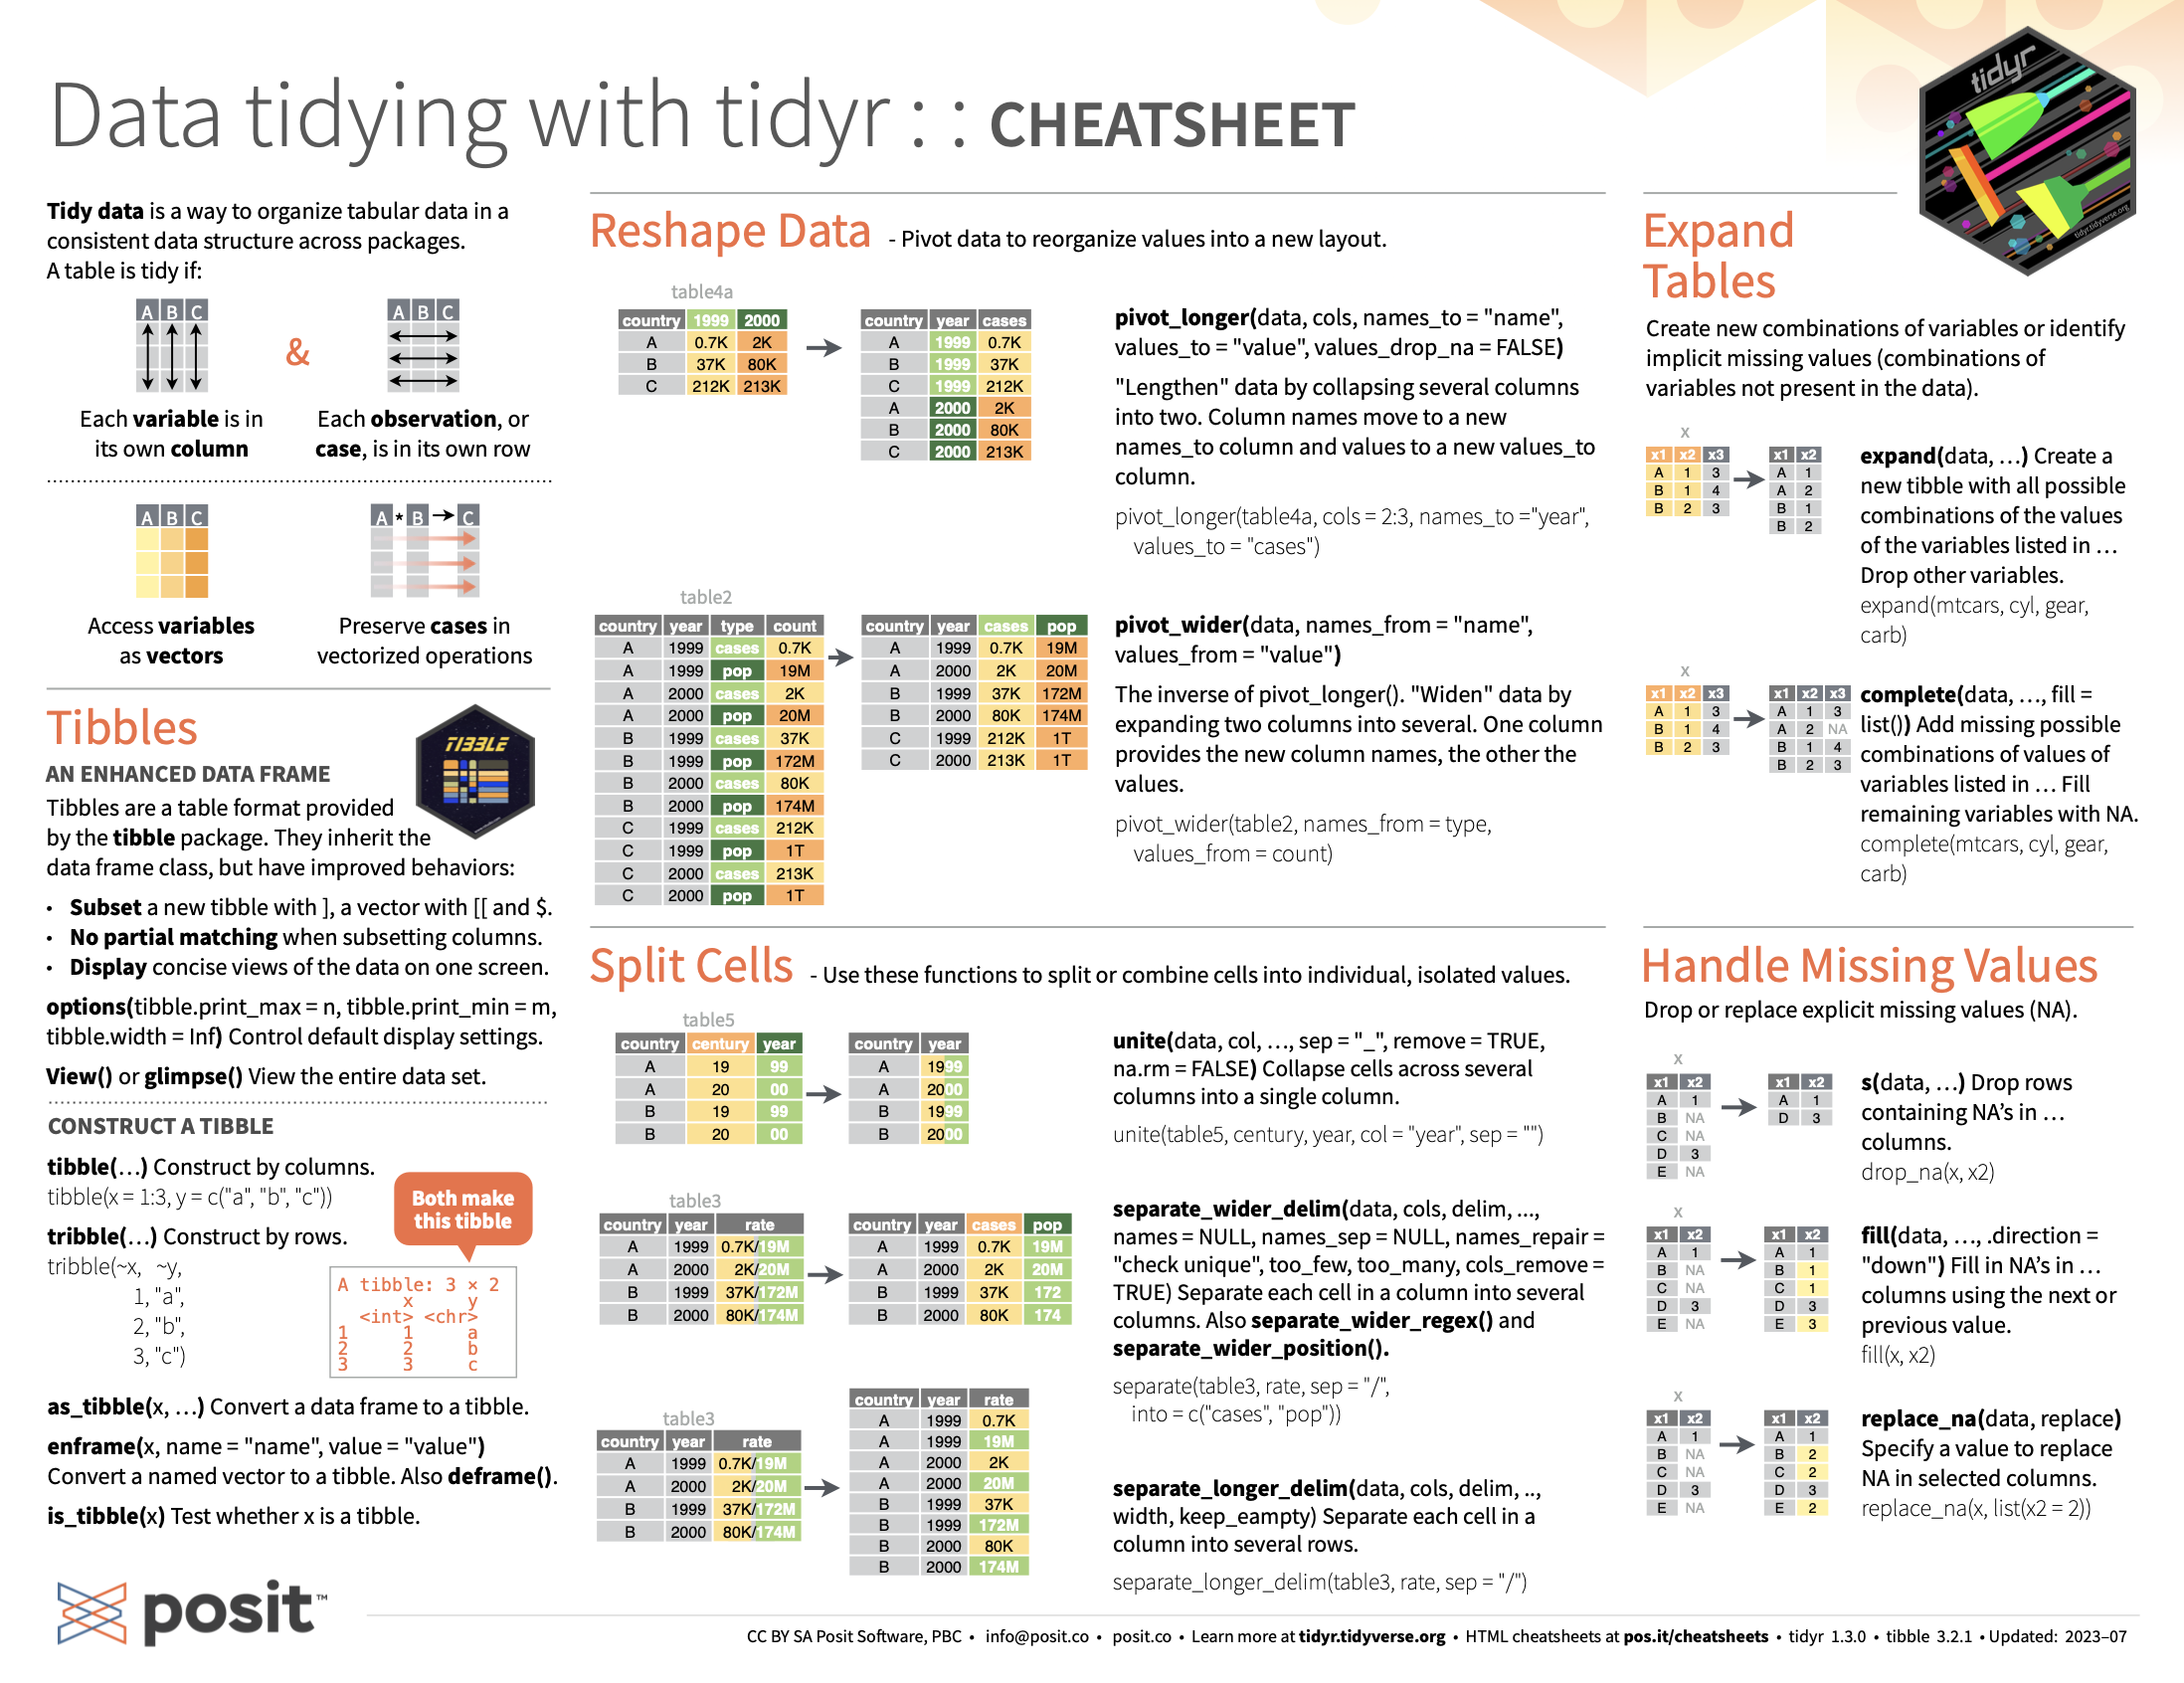
tidyr, for tidy data. (today)
readr, for data import.
purrr, for functional programming.
tibble, for tibbles (modernized data frames).
stringr, for strings.
forcats, for factors.

Tidyverse works similarly to any other package, but when activated, 8 packages are activated at the same time. The following message should appear then on the console:
The pipe
“The magrittr (to be pronounced with a sophisticated french accent) package has two aims: decrease development time and improve readability and maintainability of code. Or even shortr: make your code smokin’ (puff puff)!
To achieve its humble aims, magrittr (remember the accent) provides a new “pipe”-like operator, %>%, with which you may pipe a value forward into an expression or function call; something along the lines of x %>% f, rather than f(x). This is not an unknown feature elsewhere; a prime example is the
|>operator used extensively in F# (to say the least) and indeed this – along with Unix pipes – served as a motivation for developing the magrittr package.”
Source: Package description
Since last year, the `|>` pipe operator has been integrated into R 4.2 as a native feature. It offers nearly identical functionality to its predecessor, but there are certain cases where the syntax differs.

You can an insert a pipe operatior by
ctrl + shift + M/command + shift + MTo understand its relevance, you should think about it like telling … then to the program
Lets return to the fertility_df data frame.
fertility_df <- read_csv("https://stats.oecd.org/sdmx-json/data/DP_LIVE/.FERTILITY.../OECD?contentType=csv&detail=code&separator=comma&csv-lang=en")fertility_df# A tibble: 3,294 × 8
LOCATION INDICATOR SUBJECT MEASURE FREQUENCY TIME Value `Flag Codes`
<chr> <chr> <chr> <chr> <chr> <dbl> <dbl> <lgl>
1 AUS FERTILITY TOT CHD_WOMAN A 1960 3.45 NA
2 AUS FERTILITY TOT CHD_WOMAN A 1961 3.55 NA
3 AUS FERTILITY TOT CHD_WOMAN A 1962 3.43 NA
4 AUS FERTILITY TOT CHD_WOMAN A 1963 3.34 NA
5 AUS FERTILITY TOT CHD_WOMAN A 1964 3.15 NA
6 AUS FERTILITY TOT CHD_WOMAN A 1965 2.97 NA
7 AUS FERTILITY TOT CHD_WOMAN A 1966 2.89 NA
8 AUS FERTILITY TOT CHD_WOMAN A 1967 2.85 NA
9 AUS FERTILITY TOT CHD_WOMAN A 1968 2.89 NA
10 AUS FERTILITY TOT CHD_WOMAN A 1969 2.89 NA
# ℹ 3,284 more rowsLets take an example with the following two functions from the {dplyr} package:
filter()subset a data frame, retaining all rows that satisfy your conditionscount()count the unique values of one or more variables
How many observations are there by years that are above 2.1?
Step 1. Filter to rows where Value >= 2.1
filter(.data = fertility_df, Value >= 2.1)# A tibble: 1,369 × 8
LOCATION INDICATOR SUBJECT MEASURE FREQUENCY TIME Value `Flag Codes`
<chr> <chr> <chr> <chr> <chr> <dbl> <dbl> <lgl>
1 AUS FERTILITY TOT CHD_WOMAN A 1960 3.45 NA
2 AUS FERTILITY TOT CHD_WOMAN A 1961 3.55 NA
3 AUS FERTILITY TOT CHD_WOMAN A 1962 3.43 NA
4 AUS FERTILITY TOT CHD_WOMAN A 1963 3.34 NA
5 AUS FERTILITY TOT CHD_WOMAN A 1964 3.15 NA
6 AUS FERTILITY TOT CHD_WOMAN A 1965 2.97 NA
7 AUS FERTILITY TOT CHD_WOMAN A 1966 2.89 NA
8 AUS FERTILITY TOT CHD_WOMAN A 1967 2.85 NA
9 AUS FERTILITY TOT CHD_WOMAN A 1968 2.89 NA
10 AUS FERTILITY TOT CHD_WOMAN A 1969 2.89 NA
# ℹ 1,359 more rowsUnlike python or base R, in the case of dplyr functions, you can simply refer to the names of the variables without using “” or specifying the data frame.
The following is identical with pipe. (The outcome before the %>% is the first unspecified input of the next expression)
# A tibble: 1,369 × 8
   LOCATION INDICATOR SUBJECT MEASURE   FREQUENCY  TIME Value `Flag Codes`
   <chr>    <chr>     <chr>   <chr>     <chr>     <dbl> <dbl> <lgl>
 1 AUS      FERTILITY TOT     CHD_WOMAN A          1960  3.45 NA
 2 AUS      FERTILITY TOT     CHD_WOMAN A          1961  3.55 NA
 3 AUS      FERTILITY TOT     CHD_WOMAN A          1962  3.43 NA
 4 AUS      FERTILITY TOT     CHD_WOMAN A          1963  3.34 NA
 5 AUS      FERTILITY TOT     CHD_WOMAN A          1964  3.15 NA
 6 AUS      FERTILITY TOT     CHD_WOMAN A          1965  2.97 NA
 7 AUS      FERTILITY TOT     CHD_WOMAN A          1966  2.89 NA
 8 AUS      FERTILITY TOT     CHD_WOMAN A          1967  2.85 NA
 9 AUS      FERTILITY TOT     CHD_WOMAN A          1968  2.89 NA
10 AUS      FERTILITY TOT     CHD_WOMAN A          1969  2.89 NA
# ℹ 1,359 more rowsWithout the %>% 2 possibilities exist to use the result of the filter in the count function
1 Assigning a new data frame
2 Unreadable nesting
# A tibble: 62 × 2
    TIME     n
   <dbl> <int>
 1  1960    47
 2  1961    47
 3  1962    47
 4  1963    47
 5  1964    47
 6  1965    47
 7  1966    45
 8  1967    44
 9  1968    44
10  1969    42
# ℹ 52 more rows
With the %>%:
# A tibble: 62 × 2
    TIME     n
   <dbl> <int>
 1  1960    47
 2  1961    47
 3  1962    47
 4  1963    47
 5  1964    47
 6  1965    47
 7  1966    45
 8  1967    44
 9  1968    44
10  1969    42
# ℹ 52 more rows
No additional unnecessary object in the env, and the code readable.

Dplyr functions
select() Extract the specified columns as a table.
select(.data = fertility_df, LOCATION, TIME, Value)# A tibble: 3,294 × 3
LOCATION TIME Value
<chr> <dbl> <dbl>
1 AUS 1960 3.45
2 AUS 1961 3.55
3 AUS 1962 3.43
4 AUS 1963 3.34
5 AUS 1964 3.15
6 AUS 1965 2.97
7 AUS 1966 2.89
8 AUS 1967 2.85
9 AUS 1968 2.89
10 AUS 1969 2.89
# ℹ 3,284 more rows# A tibble: 3,294 × 3
LOCATION TIME Value
<chr> <dbl> <dbl>
1 AUS 1960 3.45
2 AUS 1961 3.55
3 AUS 1962 3.43
4 AUS 1963 3.34
5 AUS 1964 3.15
6 AUS 1965 2.97
7 AUS 1966 2.89
8 AUS 1967 2.85
9 AUS 1968 2.89
10 AUS 1969 2.89
# ℹ 3,284 more rowsIdentical outcome
# A tibble: 3,294 × 3
   LOCATION  TIME Value
   <chr>    <dbl> <dbl>
 1 AUS       1960  3.45
 2 AUS       1961  3.55
 3 AUS       1962  3.43
 4 AUS       1963  3.34
 5 AUS       1964  3.15
 6 AUS       1965  2.97
 7 AUS       1966  2.89
 8 AUS       1967  2.85
 9 AUS       1968  2.89
10 AUS       1969  2.89
# ℹ 3,284 more rows# A tibble: 3,294 × 3
LOCATION TIME Value
<chr> <dbl> <dbl>
1 AUS 1960 3.45
2 AUS 1961 3.55
3 AUS 1962 3.43
4 AUS 1963 3.34
5 AUS 1964 3.15
6 AUS 1965 2.97
7 AUS 1966 2.89
8 AUS 1967 2.85
9 AUS 1968 2.89
10 AUS 1969 2.89
# ℹ 3,284 more rowsIn this case, “" had to be used when referencing the variable namedflag code. The reason for this is that in dplyr expressions, variables containing spaces or special characters always need to be enclosed in "” To overcome the difficulties arising from special characters in the headers, the clean_names function in the janitor package provides a helpful solution, allowing all variables of a table to be renamed at once.
rename() renames columns.
# A tibble: 3,294 × 3
geo TIME fertility
<chr> <dbl> <dbl>
1 AUS 1960 3.45
2 AUS 1961 3.55
3 AUS 1962 3.43
4 AUS 1963 3.34
5 AUS 1964 3.15
6 AUS 1965 2.97
7 AUS 1966 2.89
8 AUS 1967 2.85
9 AUS 1968 2.89
10 AUS 1969 2.89
# ℹ 3,284 more rows.content-box-green[ HINT: ]
You can do it in 1 single step.
# A tibble: 3,294 × 3
geo TIME fertility
<chr> <dbl> <dbl>
1 AUS 1960 3.45
2 AUS 1961 3.55
3 AUS 1962 3.43
4 AUS 1963 3.34
5 AUS 1964 3.15
6 AUS 1965 2.97
7 AUS 1966 2.89
8 AUS 1967 2.85
9 AUS 1968 2.89
10 AUS 1969 2.89
# ℹ 3,284 more rowsMutate
mutate() computes new column(s).
countrycode::countrycode() Translates from one country naming scheme to another.
library(countrycode)
fertility_df %>%
select(LOCATION, TIME, Value) %>%
mutate(
country_name = countrycode(LOCATION, "iso3c", "country.name"),
continent = countrycode(LOCATION, "iso3c", "continent")
)# A tibble: 3,294 × 5
LOCATION TIME Value country_name continent
<chr> <dbl> <dbl> <chr> <chr>
1 AUS 1960 3.45 Australia Oceania
2 AUS 1961 3.55 Australia Oceania
3 AUS 1962 3.43 Australia Oceania
4 AUS 1963 3.34 Australia Oceania
5 AUS 1964 3.15 Australia Oceania
6 AUS 1965 2.97 Australia Oceania
7 AUS 1966 2.89 Australia Oceania
8 AUS 1967 2.85 Australia Oceania
9 AUS 1968 2.89 Australia Oceania
10 AUS 1969 2.89 Australia Oceania
# ℹ 3,284 more rowslibrary(countrycode)
fertility_df %>%
select(LOCATION, TIME, Value) %>%
mutate(
country_name = countrycode(LOCATION, "iso3c", "country.name"),
continent = countrycode(LOCATION, "iso3c", "continent"),
LOCATION = countrycode(LOCATION, "iso3c", "iso2c") # modify the original column
)# A tibble: 3,294 × 5
LOCATION TIME Value country_name continent
<chr> <dbl> <dbl> <chr> <chr>
1 AU 1960 3.45 Australia Oceania
2 AU 1961 3.55 Australia Oceania
3 AU 1962 3.43 Australia Oceania
4 AU 1963 3.34 Australia Oceania
5 AU 1964 3.15 Australia Oceania
6 AU 1965 2.97 Australia Oceania
7 AU 1966 2.89 Australia Oceania
8 AU 1967 2.85 Australia Oceania
9 AU 1968 2.89 Australia Oceania
10 AU 1969 2.89 Australia Oceania
# ℹ 3,284 more rowsIf you specify a single value instead of a vector, then the values will be repeated by the number of rows.
# A tibble: 3,294 × 4
LOCATION TIME Value avg_fertility
<chr> <dbl> <dbl> <dbl>
1 AUS 1960 3.45 2.34
2 AUS 1961 3.55 2.34
3 AUS 1962 3.43 2.34
4 AUS 1963 3.34 2.34
5 AUS 1964 3.15 2.34
6 AUS 1965 2.97 2.34
7 AUS 1966 2.89 2.34
8 AUS 1967 2.85 2.34
9 AUS 1968 2.89 2.34
10 AUS 1969 2.89 2.34
# ℹ 3,284 more rowsTips for mutate
ifelse
ifelse() returns a vector filled with elements selected from either yes or no depending on the condition.
fertility_df %>%
select(LOCATION, TIME, Value) %>%
mutate(
avg_fertility = mean(Value),
above_avg = Value > avg_fertility,
high = ifelse(above_avg, "yes, above the avg", "no")
)# A tibble: 3,294 × 6
LOCATION TIME Value avg_fertility above_avg high
<chr> <dbl> <dbl> <dbl> <lgl> <chr>
1 AUS 1960 3.45 2.34 TRUE yes, above the avg
2 AUS 1961 3.55 2.34 TRUE yes, above the avg
3 AUS 1962 3.43 2.34 TRUE yes, above the avg
4 AUS 1963 3.34 2.34 TRUE yes, above the avg
5 AUS 1964 3.15 2.34 TRUE yes, above the avg
6 AUS 1965 2.97 2.34 TRUE yes, above the avg
7 AUS 1966 2.89 2.34 TRUE yes, above the avg
8 AUS 1967 2.85 2.34 TRUE yes, above the avg
9 AUS 1968 2.89 2.34 TRUE yes, above the avg
10 AUS 1969 2.89 2.34 TRUE yes, above the avg
# ℹ 3,284 more rowsifelse() returns a vector filled with elements selected from either yes or no depending on the condition.
fertility_df %>%
select(LOCATION, TIME, Value) %>%
mutate(
avg_fertility = mean(Value),
above_avg = Value > avg_fertility,
high = ifelse(above_avg, "yes, above the avg", "no")
)# A tibble: 3,294 × 6
LOCATION TIME Value avg_fertility above_avg high
<chr> <dbl> <dbl> <dbl> <lgl> <chr>
1 AUS 1960 3.45 2.34 TRUE yes, above the avg
2 AUS 1961 3.55 2.34 TRUE yes, above the avg
3 AUS 1962 3.43 2.34 TRUE yes, above the avg
4 AUS 1963 3.34 2.34 TRUE yes, above the avg
5 AUS 1964 3.15 2.34 TRUE yes, above the avg
6 AUS 1965 2.97 2.34 TRUE yes, above the avg
7 AUS 1966 2.89 2.34 TRUE yes, above the avg
8 AUS 1967 2.85 2.34 TRUE yes, above the avg
9 AUS 1968 2.89 2.34 TRUE yes, above the avg
10 AUS 1969 2.89 2.34 TRUE yes, above the avg
# ℹ 3,284 more rowsWith a single step:
fertility_df %>%
select(LOCATION, TIME, Value) %>%
mutate(
high = ifelse(Value > mean(Value), "yes, above the avg", "no")
)# A tibble: 3,294 × 4
LOCATION TIME Value high
<chr> <dbl> <dbl> <chr>
1 AUS 1960 3.45 yes, above the avg
2 AUS 1961 3.55 yes, above the avg
3 AUS 1962 3.43 yes, above the avg
4 AUS 1963 3.34 yes, above the avg
5 AUS 1964 3.15 yes, above the avg
6 AUS 1965 2.97 yes, above the avg
7 AUS 1966 2.89 yes, above the avg
8 AUS 1967 2.85 yes, above the avg
9 AUS 1968 2.89 yes, above the avg
10 AUS 1969 2.89 yes, above the avg
# ℹ 3,284 more rowscase_when
case_when() Vectorise multiple if_else() statements (return the first value associated with TRUE condition)
fertility_df %>%
select(LOCATION, TIME, Value) %>%
mutate(
fertility_level = case_when(
Value >= 5 ~ "very high",
Value >= 3 ~ "high",
Value >= 2.1 ~ "above replacement r",
Value >= 1.3 ~ "below replacemnt r",
TRUE ~ "very low"
)
)# A tibble: 3,294 × 4
LOCATION TIME Value fertility_level
<chr> <dbl> <dbl> <chr>
1 AUS 1960 3.45 high
2 AUS 1961 3.55 high
3 AUS 1962 3.43 high
4 AUS 1963 3.34 high
5 AUS 1964 3.15 high
6 AUS 1965 2.97 above replacement r
7 AUS 1966 2.89 above replacement r
8 AUS 1967 2.85 above replacement r
9 AUS 1968 2.89 above replacement r
10 AUS 1969 2.89 above replacement r
# ℹ 3,284 more rowsFrom the latest release:
fertility_df %>%
select(LOCATION, TIME, Value) %>%
mutate(
fertility_level = case_when(
Value >= 5 ~ "very high",
Value >= 3 ~ "high",
Value >= 2.1 ~ "above replacement r",
Value >= 1.3 ~ "below replacemnt r",
.default = "very low"
)
)# A tibble: 3,294 × 4
LOCATION TIME Value fertility_level
<chr> <dbl> <dbl> <chr>
1 AUS 1960 3.45 high
2 AUS 1961 3.55 high
3 AUS 1962 3.43 high
4 AUS 1963 3.34 high
5 AUS 1964 3.15 high
6 AUS 1965 2.97 above replacement r
7 AUS 1966 2.89 above replacement r
8 AUS 1967 2.85 above replacement r
9 AUS 1968 2.89 above replacement r
10 AUS 1969 2.89 above replacement r
# ℹ 3,284 more rowstransmute() Compute new column(s), drop others. (= select + mutate)
filter() Extract rows that meet logical criteria.
# A tibble: 3,170 × 8
LOCATION INDICATOR SUBJECT MEASURE FREQUENCY TIME Value `Flag Codes`
<chr> <chr> <chr> <chr> <chr> <dbl> <dbl> <lgl>
1 AUS FERTILITY TOT CHD_WOMAN A 1960 3.45 NA
2 AUS FERTILITY TOT CHD_WOMAN A 1961 3.55 NA
3 AUS FERTILITY TOT CHD_WOMAN A 1962 3.43 NA
4 AUS FERTILITY TOT CHD_WOMAN A 1963 3.34 NA
5 AUS FERTILITY TOT CHD_WOMAN A 1964 3.15 NA
6 AUS FERTILITY TOT CHD_WOMAN A 1965 2.97 NA
7 AUS FERTILITY TOT CHD_WOMAN A 1966 2.89 NA
8 AUS FERTILITY TOT CHD_WOMAN A 1967 2.85 NA
9 AUS FERTILITY TOT CHD_WOMAN A 1968 2.89 NA
10 AUS FERTILITY TOT CHD_WOMAN A 1969 2.89 NA
# ℹ 3,160 more rowsslice() Select rows by position
# A tibble: 4 × 8
LOCATION INDICATOR SUBJECT MEASURE FREQUENCY TIME Value `Flag Codes`
<chr> <chr> <chr> <chr> <chr> <dbl> <dbl> <lgl>
1 AUS FERTILITY TOT CHD_WOMAN A 1961 3.55 NA
2 AUS FERTILITY TOT CHD_WOMAN A 1962 3.43 NA
3 AUS FERTILITY TOT CHD_WOMAN A 1963 3.34 NA
4 AUS FERTILITY TOT CHD_WOMAN A 1964 3.15 NA sample_n Select n random rows.
# A tibble: 6 × 8
LOCATION INDICATOR SUBJECT MEASURE FREQUENCY TIME Value `Flag Codes`
<chr> <chr> <chr> <chr> <chr> <dbl> <dbl> <lgl>
1 PRT FERTILITY TOT CHD_WOMAN A 1999 1.51 NA
2 ROU FERTILITY TOT CHD_WOMAN A 2003 1.3 NA
3 ESP FERTILITY TOT CHD_WOMAN A 2020 1.19 NA
4 USA FERTILITY TOT CHD_WOMAN A 1977 1.79 NA
5 ISR FERTILITY TOT CHD_WOMAN A 1988 3.06 NA
6 GRC FERTILITY TOT CHD_WOMAN A 1971 2.32 NA In order to ensure that R consistently generates the same “random” sample, you can utilize the set.seed function. This function has the ability to influence all sources of randomness within your ongoing session. Use it for your research project, if reproducibility is important.
arrange() Order rows by values of a column or columns (low to high), use with desc() to order from high to low.
# A tibble: 3,294 × 3
LOCATION TIME Value
<chr> <dbl> <dbl>
1 KOR 2021 0.81
2 KOR 2020 0.84
3 KOR 2019 0.92
4 KOR 2018 0.98
5 KOR 2017 1.05
6 KOR 2005 1.09
7 BGR 1997 1.09
8 LVA 1998 1.1
9 LVA 1997 1.11
10 BGR 1998 1.11
# ℹ 3,284 more rows# A tibble: 3,294 × 3
LOCATION TIME Value
<chr> <dbl> <dbl>
1 SAU 1964 7.67
2 SAU 1965 7.66
3 SAU 1966 7.66
4 SAU 1967 7.66
5 SAU 1963 7.65
6 SAU 1962 7.64
7 SAU 1960 7.63
8 SAU 1961 7.63
9 SAU 1968 7.63
10 SAU 1969 7.6
# ℹ 3,284 more rowsGrouping
group_by() Create a “grouped” copy of a table.
summarise() Compute table of summaries.
# A tibble: 3,294 × 8
# Groups: LOCATION [54]
LOCATION INDICATOR SUBJECT MEASURE FREQUENCY TIME Value `Flag Codes`
<chr> <chr> <chr> <chr> <chr> <dbl> <dbl> <lgl>
1 AUS FERTILITY TOT CHD_WOMAN A 1960 3.45 NA
2 AUS FERTILITY TOT CHD_WOMAN A 1961 3.55 NA
3 AUS FERTILITY TOT CHD_WOMAN A 1962 3.43 NA
4 AUS FERTILITY TOT CHD_WOMAN A 1963 3.34 NA
5 AUS FERTILITY TOT CHD_WOMAN A 1964 3.15 NA
6 AUS FERTILITY TOT CHD_WOMAN A 1965 2.97 NA
7 AUS FERTILITY TOT CHD_WOMAN A 1966 2.89 NA
8 AUS FERTILITY TOT CHD_WOMAN A 1967 2.85 NA
9 AUS FERTILITY TOT CHD_WOMAN A 1968 2.89 NA
10 AUS FERTILITY TOT CHD_WOMAN A 1969 2.89 NA
# ℹ 3,284 more rows# A tibble: 54 × 2
LOCATION avg_fertility
<chr> <dbl>
1 ARG 2.79
2 AUS 2.13
3 AUT 1.72
4 BEL 1.84
5 BGR 1.76
6 BRA 3.29
7 CAN 1.91
8 CHE 1.70
9 CHL 2.68
10 CHN 2.91
# ℹ 44 more rowsExample: number of observations
# A tibble: 54 × 2
LOCATION n_obs
<chr> <int>
1 ARG 62
2 AUS 62
3 AUT 62
4 BEL 62
5 BGR 62
6 BRA 62
7 CAN 62
8 CHE 62
9 CHL 62
10 CHN 62
# ℹ 44 more rowsEvery other manipulation will behave differently if the data frame is grouped (We frequently utilise this).
fertility_df %>%
select(LOCATION, TIME, Value) %>%
group_by(LOCATION) %>%
mutate(avg_fertility = mean(Value))# A tibble: 3,294 × 4
# Groups: LOCATION [54]
LOCATION TIME Value avg_fertility
<chr> <dbl> <dbl> <dbl>
1 AUS 1960 3.45 2.13
2 AUS 1961 3.55 2.13
3 AUS 1962 3.43 2.13
4 AUS 1963 3.34 2.13
5 AUS 1964 3.15 2.13
6 AUS 1965 2.97 2.13
7 AUS 1966 2.89 2.13
8 AUS 1967 2.85 2.13
9 AUS 1968 2.89 2.13
10 AUS 1969 2.89 2.13
# ℹ 3,284 more rowsExercise
In which decade did the average fertility rate of European countries decrease the most? (in absolute magnitude)
…if, …at, …all (deprecated)
Some of the previously listed functions have extended versions.
Select all columns where the condition is TRUE
# A tibble: 3,294 × 2
TIME Value
<dbl> <dbl>
1 1960 3.45
2 1961 3.55
3 1962 3.43
4 1963 3.34
5 1964 3.15
6 1965 2.97
7 1966 2.89
8 1967 2.85
9 1968 2.89
10 1969 2.89
# ℹ 3,284 more rowsModify all columns where the condition is true
You will utilize lambda-style functions in this context. This implies that after the tilde (~), you may reference the current element using the dot operator (.).
# A tibble: 3,294 × 8
LOCATION INDICATOR SUBJECT MEASURE FREQUENCY TIME Value `Flag Codes`
<chr> <chr> <chr> <chr> <chr> <dbl> <dbl> <lgl>
1 AUS FERTILITY TOT CHD_WOMAN A 19600 34.5 NA
2 AUS FERTILITY TOT CHD_WOMAN A 19610 35.5 NA
3 AUS FERTILITY TOT CHD_WOMAN A 19620 34.3 NA
4 AUS FERTILITY TOT CHD_WOMAN A 19630 33.4 NA
5 AUS FERTILITY TOT CHD_WOMAN A 19640 31.5 NA
6 AUS FERTILITY TOT CHD_WOMAN A 19650 29.7 NA
7 AUS FERTILITY TOT CHD_WOMAN A 19660 28.9 NA
8 AUS FERTILITY TOT CHD_WOMAN A 19670 28.5 NA
9 AUS FERTILITY TOT CHD_WOMAN A 19680 28.9 NA
10 AUS FERTILITY TOT CHD_WOMAN A 19690 28.9 NA
# ℹ 3,284 more rowsAcross/where
The concepts of “across” and “where” represent relatively new functions that offer an alternative to the previously used if/at/all notations. These functions provide us with a more efficient and reliable approach, eliminating the need for dependence on the aforementioned notations.
# A tibble: 3,294 × 3
   LOCATION  TIME Value
   <chr>    <dbl> <dbl>
 1 AUS       1960  3.45
 2 AUS       1961  3.55
 3 AUS       1962  3.43
 4 AUS       1963  3.34
 5 AUS       1964  3.15
 6 AUS       1965  2.97
 7 AUS       1966  2.89
 8 AUS       1967  2.85
 9 AUS       1968  2.89
10 AUS       1969  2.89
# ℹ 3,284 more rows# A tibble: 3,294 × 3
LOCATION TIME Value
<chr> <dbl> <dbl>
1 AUS 1991. 2.34
2 AUS 1991. 2.34
3 AUS 1991. 2.34
4 AUS 1991. 2.34
5 AUS 1991. 2.34
6 AUS 1991. 2.34
7 AUS 1991. 2.34
8 AUS 1991. 2.34
9 AUS 1991. 2.34
10 AUS 1991. 2.34
# ℹ 3,284 more rowsfertility_df |>
select(LOCATION, where(is.numeric)) |>
mutate(
across(is.numeric, list(avg = mean), .names = "{.col}_{.fn}")
)# A tibble: 3,294 × 5
LOCATION TIME Value TIME_avg Value_avg
<chr> <dbl> <dbl> <dbl> <dbl>
1 AUS 1960 3.45 1991. 2.34
2 AUS 1961 3.55 1991. 2.34
3 AUS 1962 3.43 1991. 2.34
4 AUS 1963 3.34 1991. 2.34
5 AUS 1964 3.15 1991. 2.34
6 AUS 1965 2.97 1991. 2.34
7 AUS 1966 2.89 1991. 2.34
8 AUS 1967 2.85 1991. 2.34
9 AUS 1968 2.89 1991. 2.34
10 AUS 1969 2.89 1991. 2.34
# ℹ 3,284 more rowsTidyr functions
The goal of tidyr is to help you create tidy data. Tidy data is data where:
Every column is variable.
Every row is an observation.
Every cell is a single value.
Wide/long
Datasets are in long on wide format (but never in the currently desired one) 😆
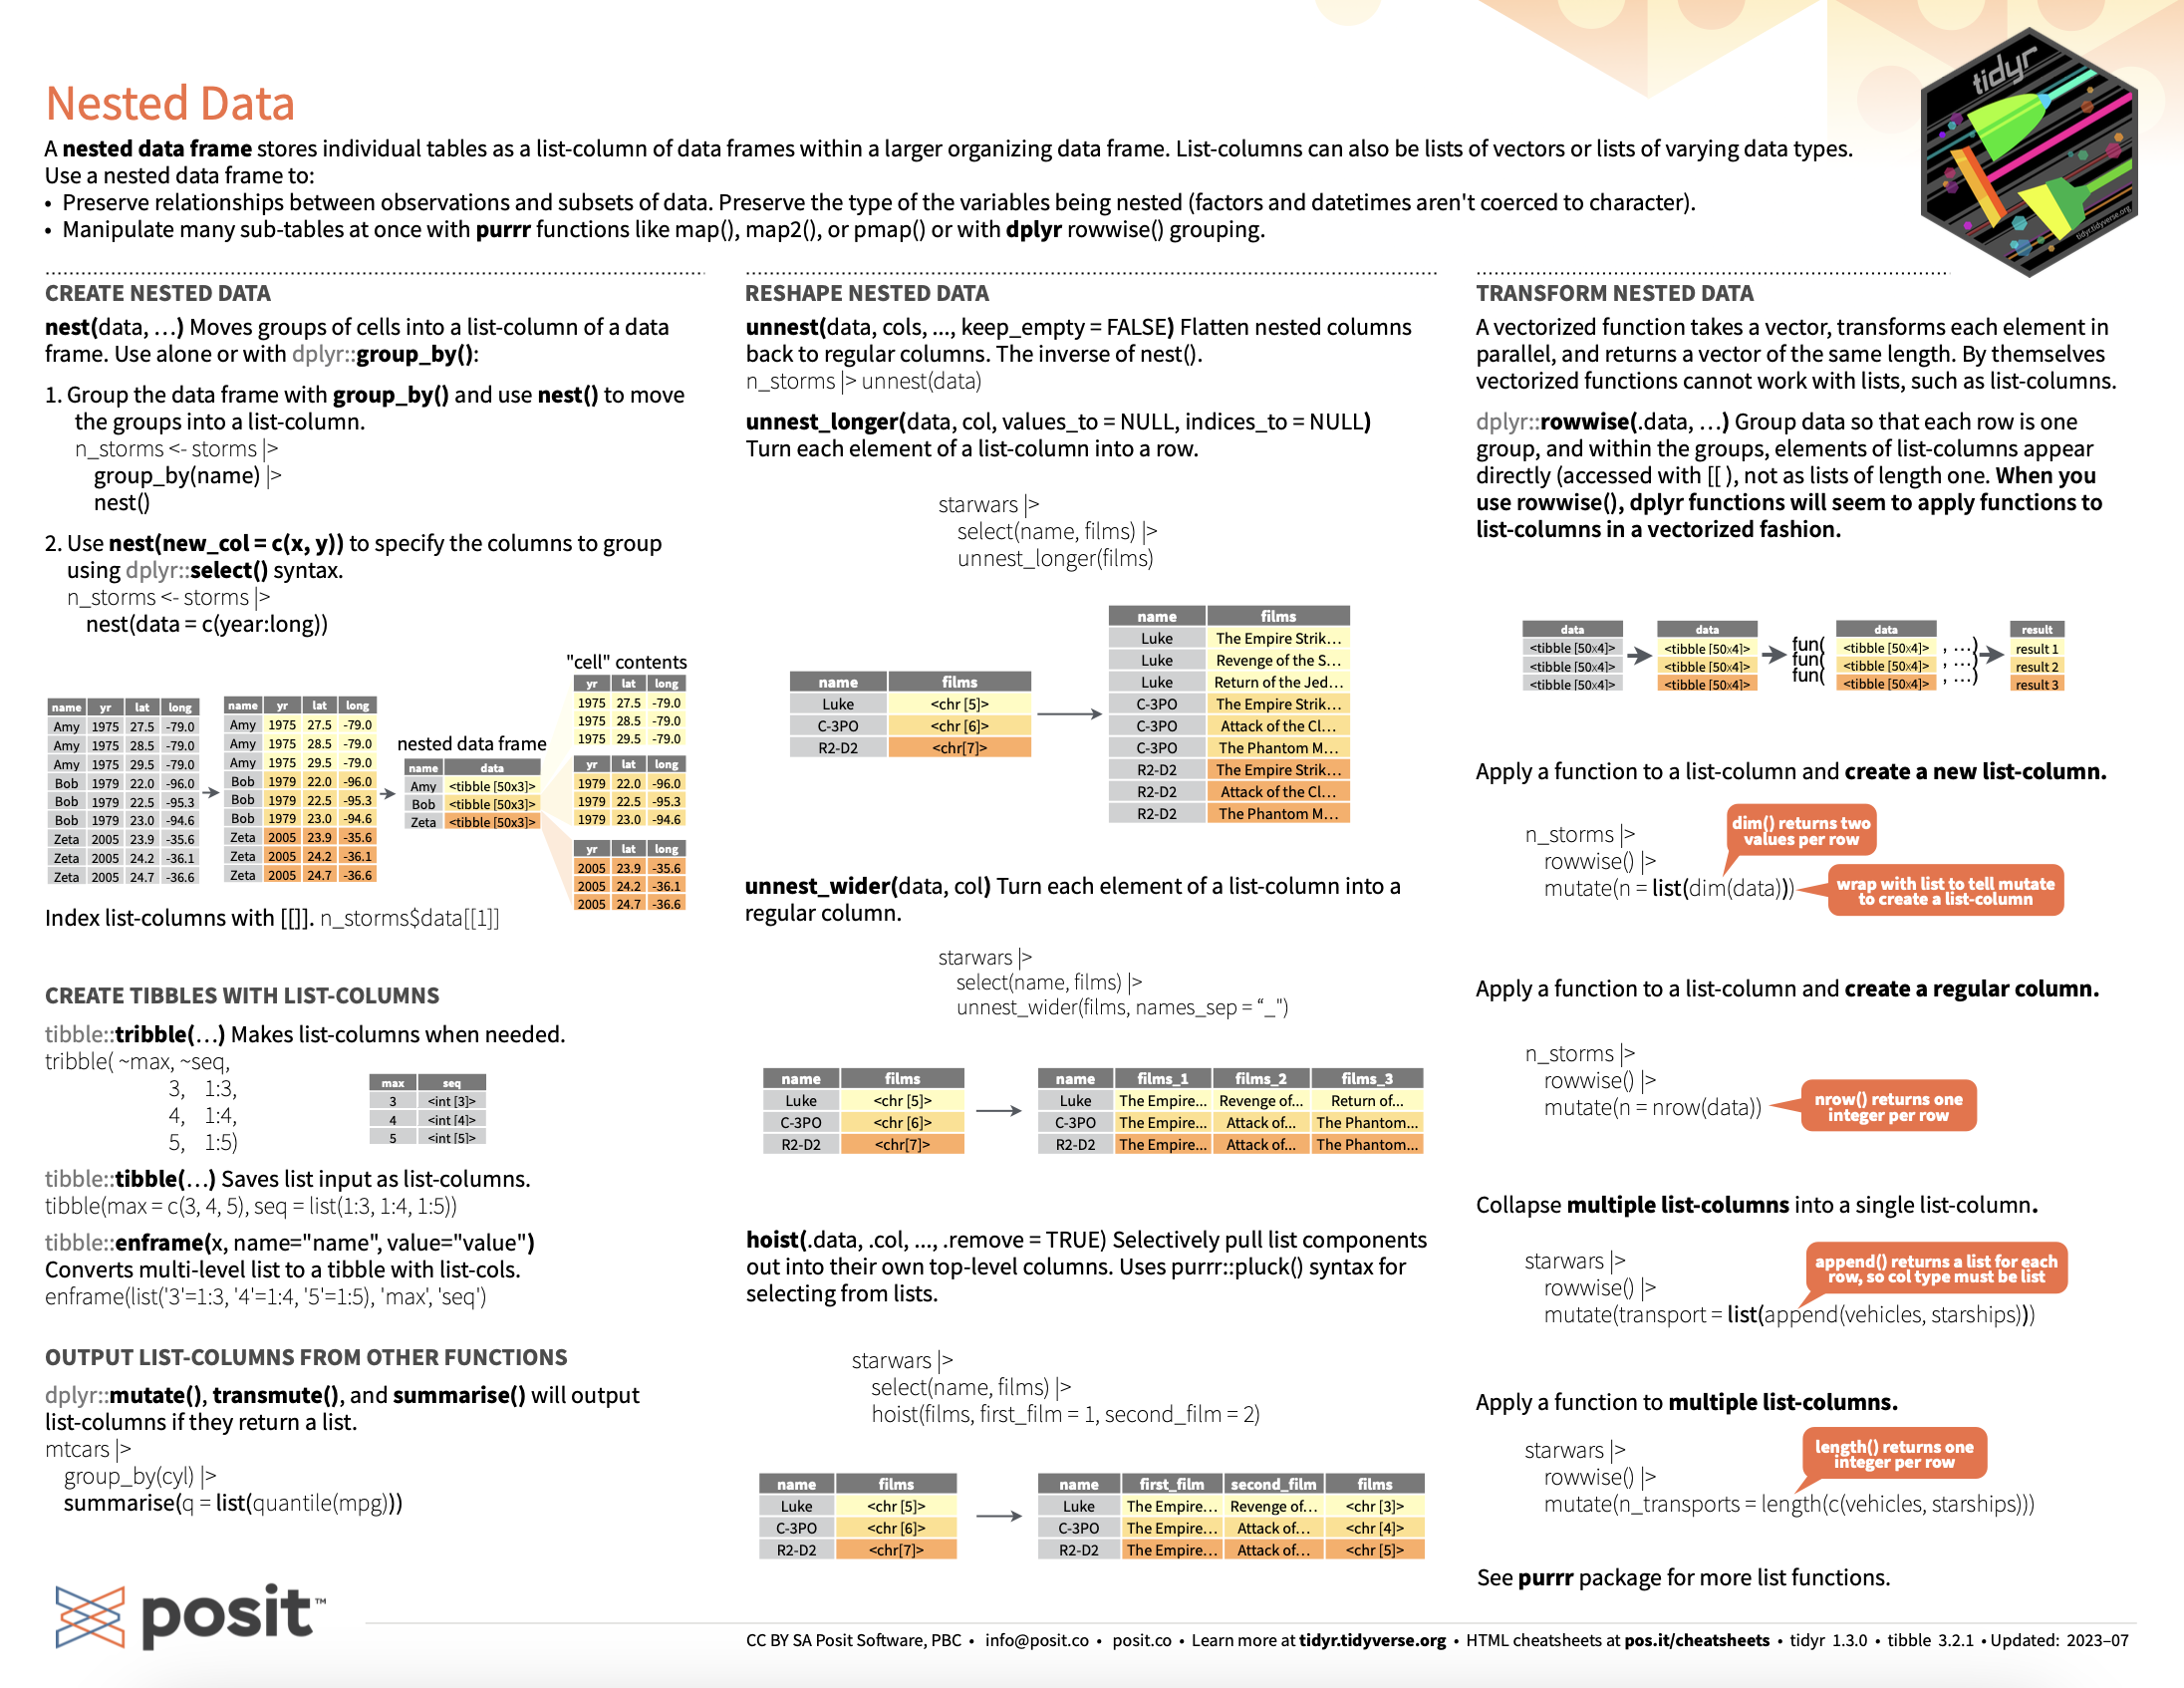
The following example is the one we saw last week to present the apply functions. In excel you probably operated with tables in wide format, but in R we always prefer the long format.
fertility_wide <- fertility_df %>%
  select(LOCATION, TIME, Value) %>%
  pivot_wider(names_from = LOCATION, values_from = Value)

fertility_wide
# A tibble: 63 × 55
TIME AUS AUT BEL CAN CZE DNK FIN FRA DEU GRC HUN ISL
<dbl> <dbl> <dbl> <dbl> <dbl> <dbl> <dbl> <dbl> <dbl> <dbl> <dbl> <dbl> <dbl>
1 1960 3.45 2.69 2.54 3.9 2.11 2.54 2.71 2.74 2.37 2.23 2.02 4.26
2 1961 3.55 2.78 2.63 3.84 2.13 2.55 2.65 2.82 2.44 2.13 1.94 3.88
3 1962 3.43 2.8 2.59 3.76 2.14 2.54 2.66 2.8 2.44 2.16 1.79 3.98
4 1963 3.34 2.82 2.68 3.67 2.33 2.64 2.66 2.9 2.51 2.14 1.82 3.98
5 1964 3.15 2.79 2.71 3.5 2.36 2.6 2.58 2.91 2.53 2.24 1.8 3.86
6 1965 2.97 2.7 2.61 3.15 2.18 2.61 2.46 2.85 2.5 2.25 1.81 3.71
7 1966 2.89 2.66 2.52 2.81 2.01 2.62 2.4 2.8 2.51 2.32 1.88 3.58
8 1967 2.85 2.62 2.41 2.6 1.9 2.35 2.32 2.67 2.45 2.45 2.01 3.28
9 1968 2.89 2.58 2.31 2.45 1.83 2.12 2.15 2.59 2.36 2.42 2.06 3.07
10 1969 2.89 2.49 2.27 2.4 1.86 2 1.94 2.53 2.21 2.36 2.04 2.99
# ℹ 53 more rows
# ℹ 42 more variables: IRL <dbl>, ITA <dbl>, JPN <dbl>, KOR <dbl>, LUX <dbl>,
# MEX <dbl>, NLD <dbl>, NZL <dbl>, NOR <dbl>, POL <dbl>, PRT <dbl>,
# SVK <dbl>, ESP <dbl>, SWE <dbl>, CHE <dbl>, TUR <dbl>, GBR <dbl>,
# USA <dbl>, BRA <dbl>, CHL <dbl>, CHN <dbl>, EST <dbl>, IND <dbl>,
# IDN <dbl>, ISR <dbl>, RUS <dbl>, SVN <dbl>, ZAF <dbl>, COL <dbl>,
# LVA <dbl>, LTU <dbl>, ARG <dbl>, BGR <dbl>, HRV <dbl>, CYP <dbl>, …Yes, pivot_longer is to convert back the table into long format.
fertility_wide %>%
  pivot_longer(
    cols = - 1, # all except the 1st
    # 2:last_col()
    # AUS, AUT, ... also work
    names_to = "LOCATION",
    values_to = "fertility"
  )
# A tibble: 3,402 × 3
TIME LOCATION fertility
<dbl> <chr> <dbl>
1 1960 AUS 3.45
2 1960 AUT 2.69
3 1960 BEL 2.54
4 1960 CAN 3.9
5 1960 CZE 2.11
6 1960 DNK 2.54
7 1960 FIN 2.71
8 1960 FRA 2.74
9 1960 DEU 2.37
10 1960 GRC 2.23
# ℹ 3,392 more rowsMutating joins
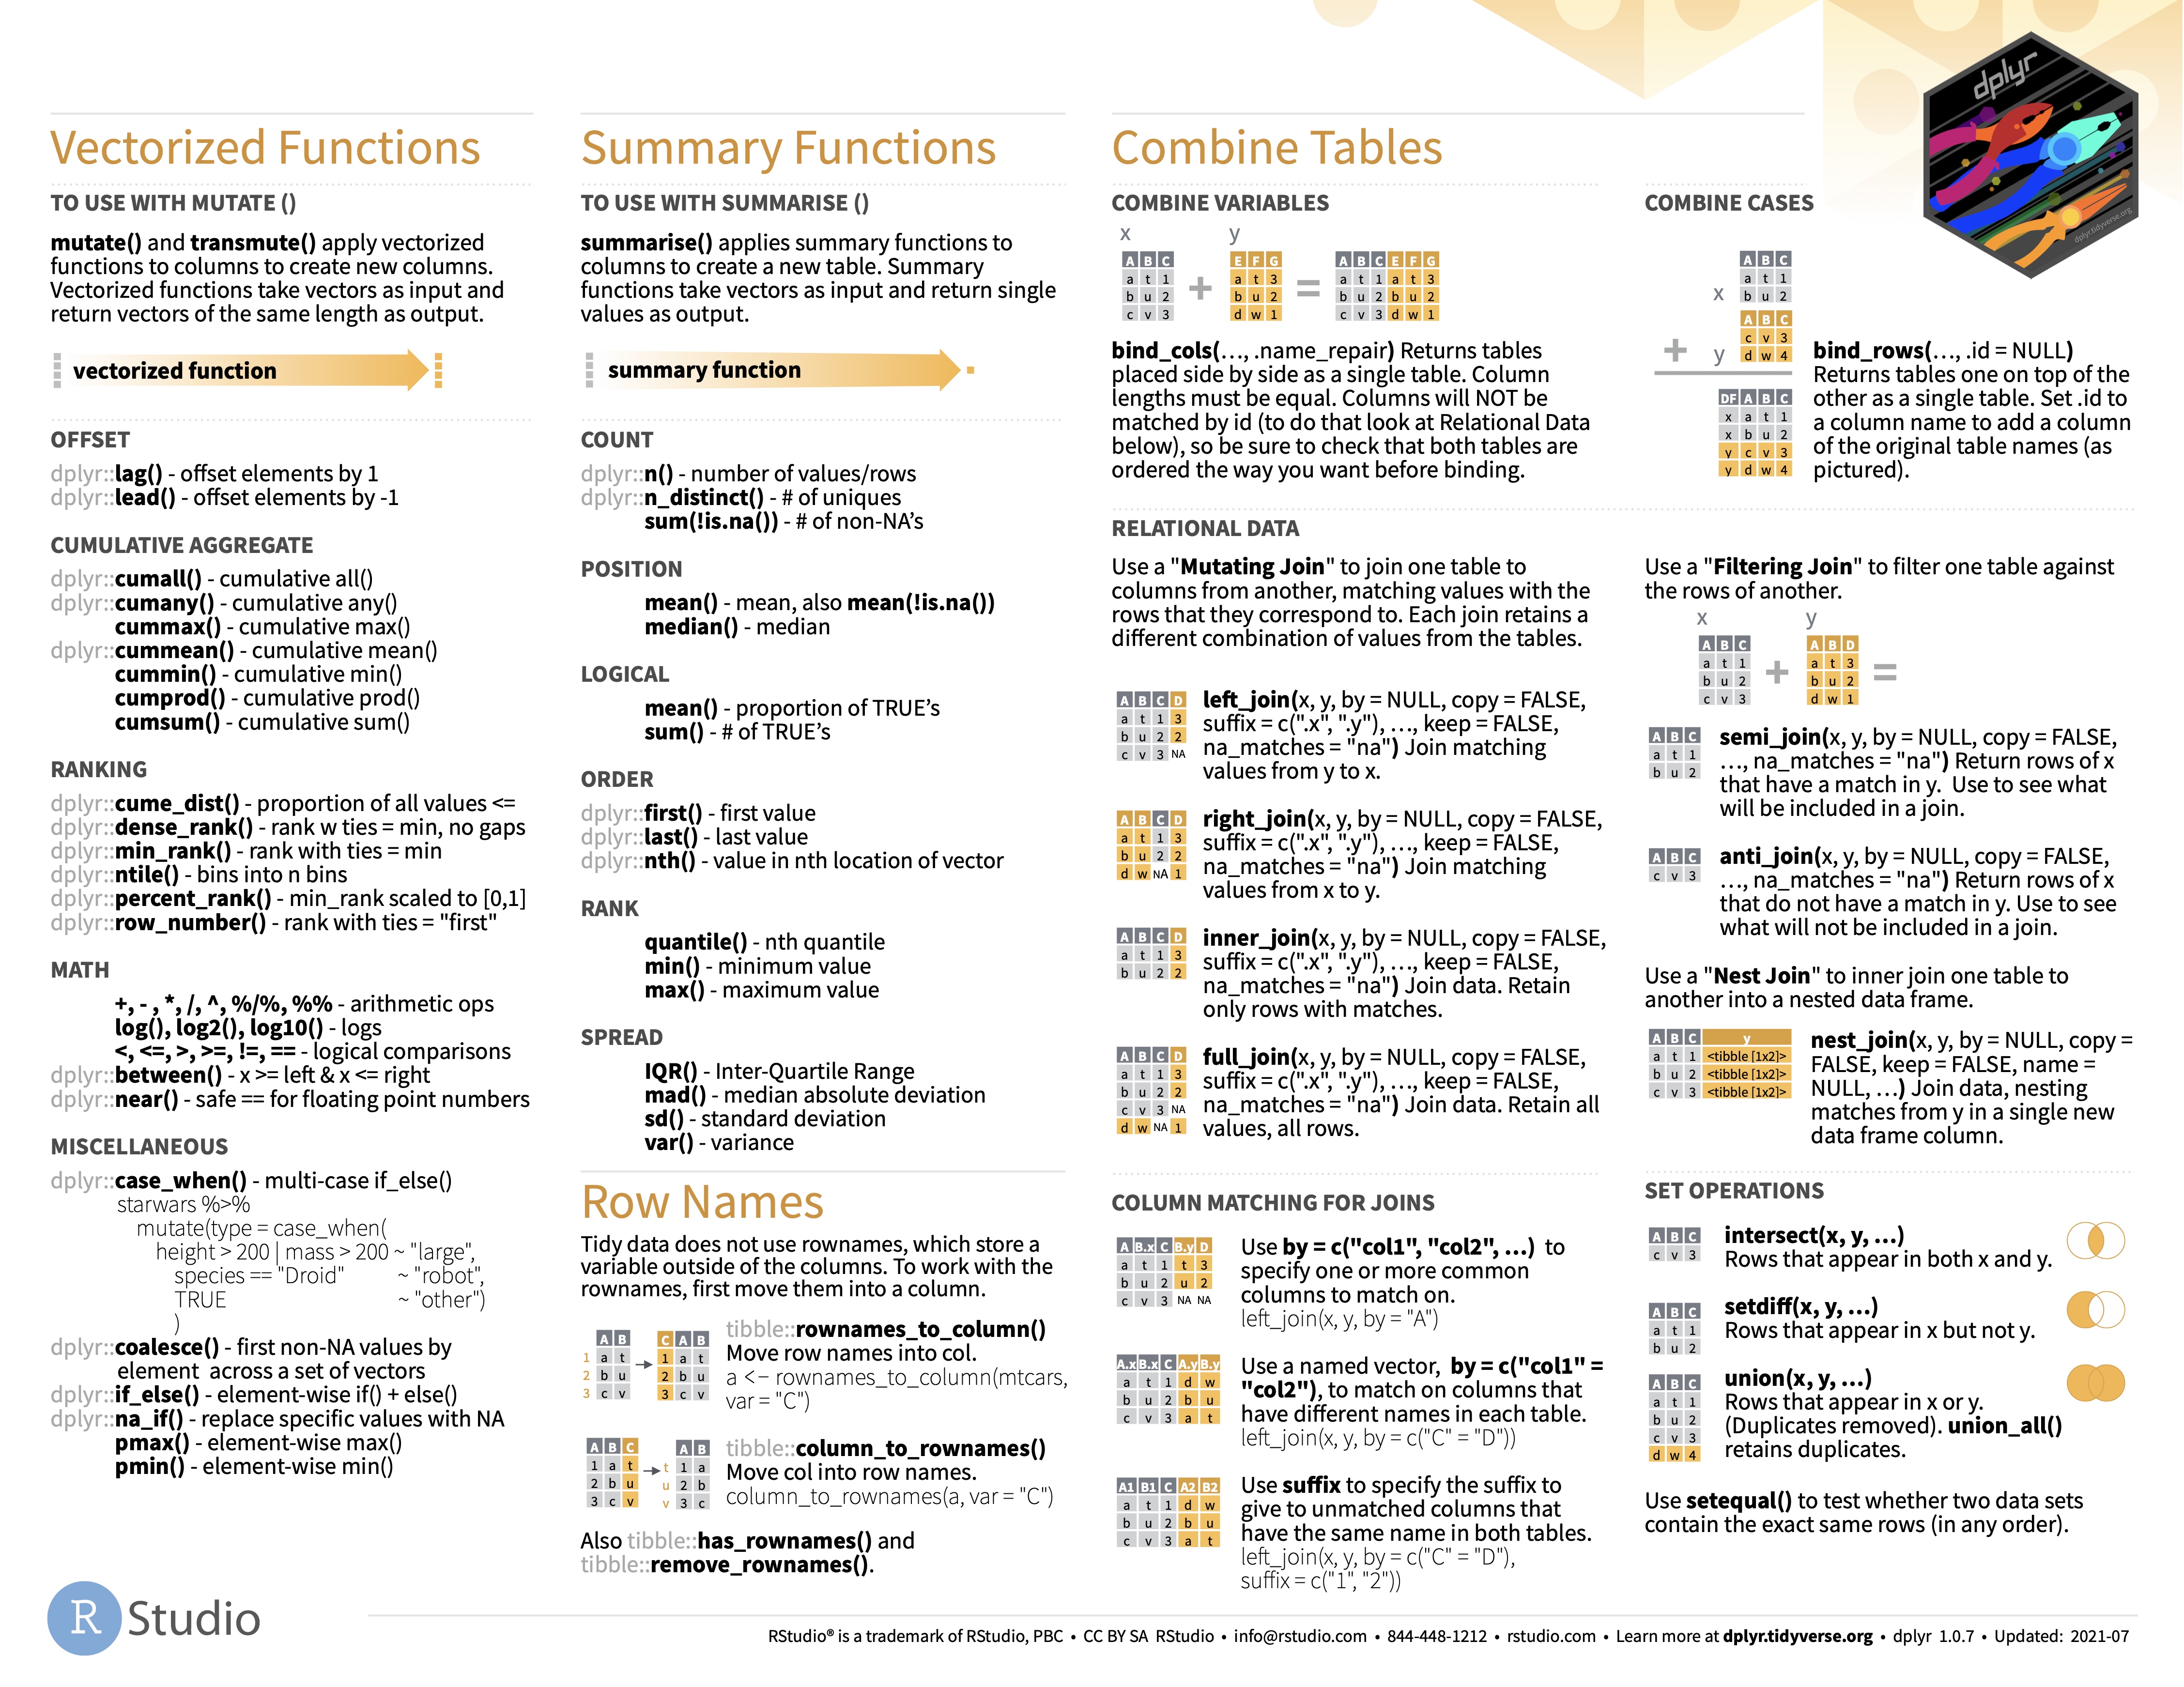
Joins are fundamental operations that merge rows from two or more tables based on the common columns (keys). These operations play a crucial role in data manipulation and analysis, especially when dealing with multiple data sources (which is almost always the case).
The difference among the functions is how they handle values from the shared columns that appear in only one of the two tables.
# Create two example data frames
df1 <- data.frame(ID = c(1, 2, 3), Name = c("Alice", "Bob", "Charlie"))
df2 <- data.frame(ID = c(2, 3, 4), Score = c(90, 85, 88))inner_join(df1, df2, by = "ID") ID Name Score
1 2 Bob 90
2 3 Charlie 85left_join(df1, df2, by = "ID") ID Name Score
1 1 Alice NA
2 2 Bob 90
3 3 Charlie 85right_join(df1, df2, by = "ID") ID Name Score
1 2 Bob 90
2 3 Charlie 85
3 4 <NA> 88full_join(df1, df2, by = "ID") ID Name Score
1 1 Alice NA
2 2 Bob 90
3 3 Charlie 85
4 4 <NA> 88semi_join(df1, df2, by = "ID") ID Name
1 2 Bob
2 3 Charlieanti_join(df1, df2, by = "ID") ID Name
1 1 Alice